ancient_trichuris
ADMIXTOOLS
Author: Stephen Doyle, stephen.doyle[at]sanger.ac.uk
Contents
- Prepared data and run admixtools
-
plotting admix data
- ADMIXTOOLS is a widely used software package for calculating admixture statistics and testing population admixture hypotheses.
- need to convert vcf to eigenstrat format first
- followed workflow from here: https://speciationgenomics.github.io/ADMIXTOOLS_admixr/
- needed additional scripts
- “convertVCFtoEigenstrat.sh” found here: https://github.com/joanam/scripts/tree/e8c6aa4b919b58d69abba01e7b7e38a892587111
- NOTE: I modified this file to allow non-standard chromosomes names, by indicating a “chom-map.txt” file in the vcftools command
- new file called “convertVCFtoEigenstrat_sd.sh”
- “convertVCFtoEigenstrat.sh” found here: https://github.com/joanam/scripts/tree/e8c6aa4b919b58d69abba01e7b7e38a892587111
- also need in path
- vcftools
- convertf (from eigensoft package)
- conda install -c bioconda eigensoft
- admixtools
- conda install -c bioconda admixtools
Prepared data and run admixtools
mkdir ~/lustre118_link/trichuris_trichiura/05_ANALYSIS/FSTATS
cd ~/lustre118_link/trichuris_trichiura/05_ANALYSIS/FSTATS

ln -s ../../04_VARIANTS/GATK_HC_MERGED/nuclear_samples3x_missing0.8_animalPhonly.recode.vcf.gz

# need to generate a list of scaffold ids, to generate a file called "chrom-map.txt". This is important to make the the scaffold names are parsed properly downstream
bcftools view -H nuclear_samples3x_missing0.8_animalPhonly.recode.vcf.gz | cut -f 1 | uniq | awk '{print $0"\t"$0}' > chrom-map.txt

# run the conversion script.
#--- note have to drop the "vcf.gz" suffix

zcat nuclear_samples3x_missing0.8_animalPhonly.recode.vcf.gz > nuclear_samples3x_missing0.8_animalPhonly.recode.vcf

./convertVCFtoEigenstrat_sd.sh nuclear_samples3x_missing0.8_animalPhonly.recode

# need to manually modify the ".ind" file - the thrid column shows "control" where they should show population IDs
# simply cat the file, copy into a text editor, change it, then move it back


# make a new populations file
> admixtools_pops.txt

# set the outgroup
OUTGROUP=BABOON

# loop throguh the populations to generate the pop file as input to admixtools
for i in BABOON CHN HND UGA ANCIENT; do
     for j in  BABOON CHN HND UGA ANCIENT; do
          if [[ "$i" == "$j" ]] || [[ "$i" == "$OUTGROUP" ]] || [[ "$j" == "$OUTGROUP" ]]; then
               :
               else
               echo -e "${i}\t${j}\t${OUTGROUP}" >> admixtools_pops.txt;
          fi;
     done;
done

# I manually removed duplicates here

# after looking at the data from the first analysis in R, also decided to set HND as an outgroup.
OUTGROUP=HND

for i in BABOON CHN HND UGA ANCIENT; do
     for j in  BABOON CHN HND UGA ANCIENT; do
          if [[ "$i" == "$j" ]] || [[ "$i" == "$OUTGROUP" ]] || [[ "$j" == "$OUTGROUP" ]]; then
               :
               else
               echo -e "${i}\t${j}\t${OUTGROUP}" >> admixtools_pops.txt;
          fi;
     done;
done


# run admixtools to generate f3 stats
qp3Pop -p PARAMETER_FILE > qp3Pop.out

# parse the output so it is user friendly to plot
grep "result" qp3Pop.out | awk '{print $2,$3,$4,$5,$6,$7,$8}' OFS="\t" > qp3Pop.clean.out
- where “PARAMETER_FILE”:
genotypename:   nuclear_samples3x_missing0.8_animalPhonly.recode.eigenstratgeno (in eigenstrat format)
snpname:        nuclear_samples3x_missing0.8_animalPhonly.recode.snp      (in eigenstrat format)
indivname:      nuclear_samples3x_missing0.8_animalPhonly.recode.ind    (in eigenstrat format)
popfilename:    admixtools_pops.txt
inbreed: YES
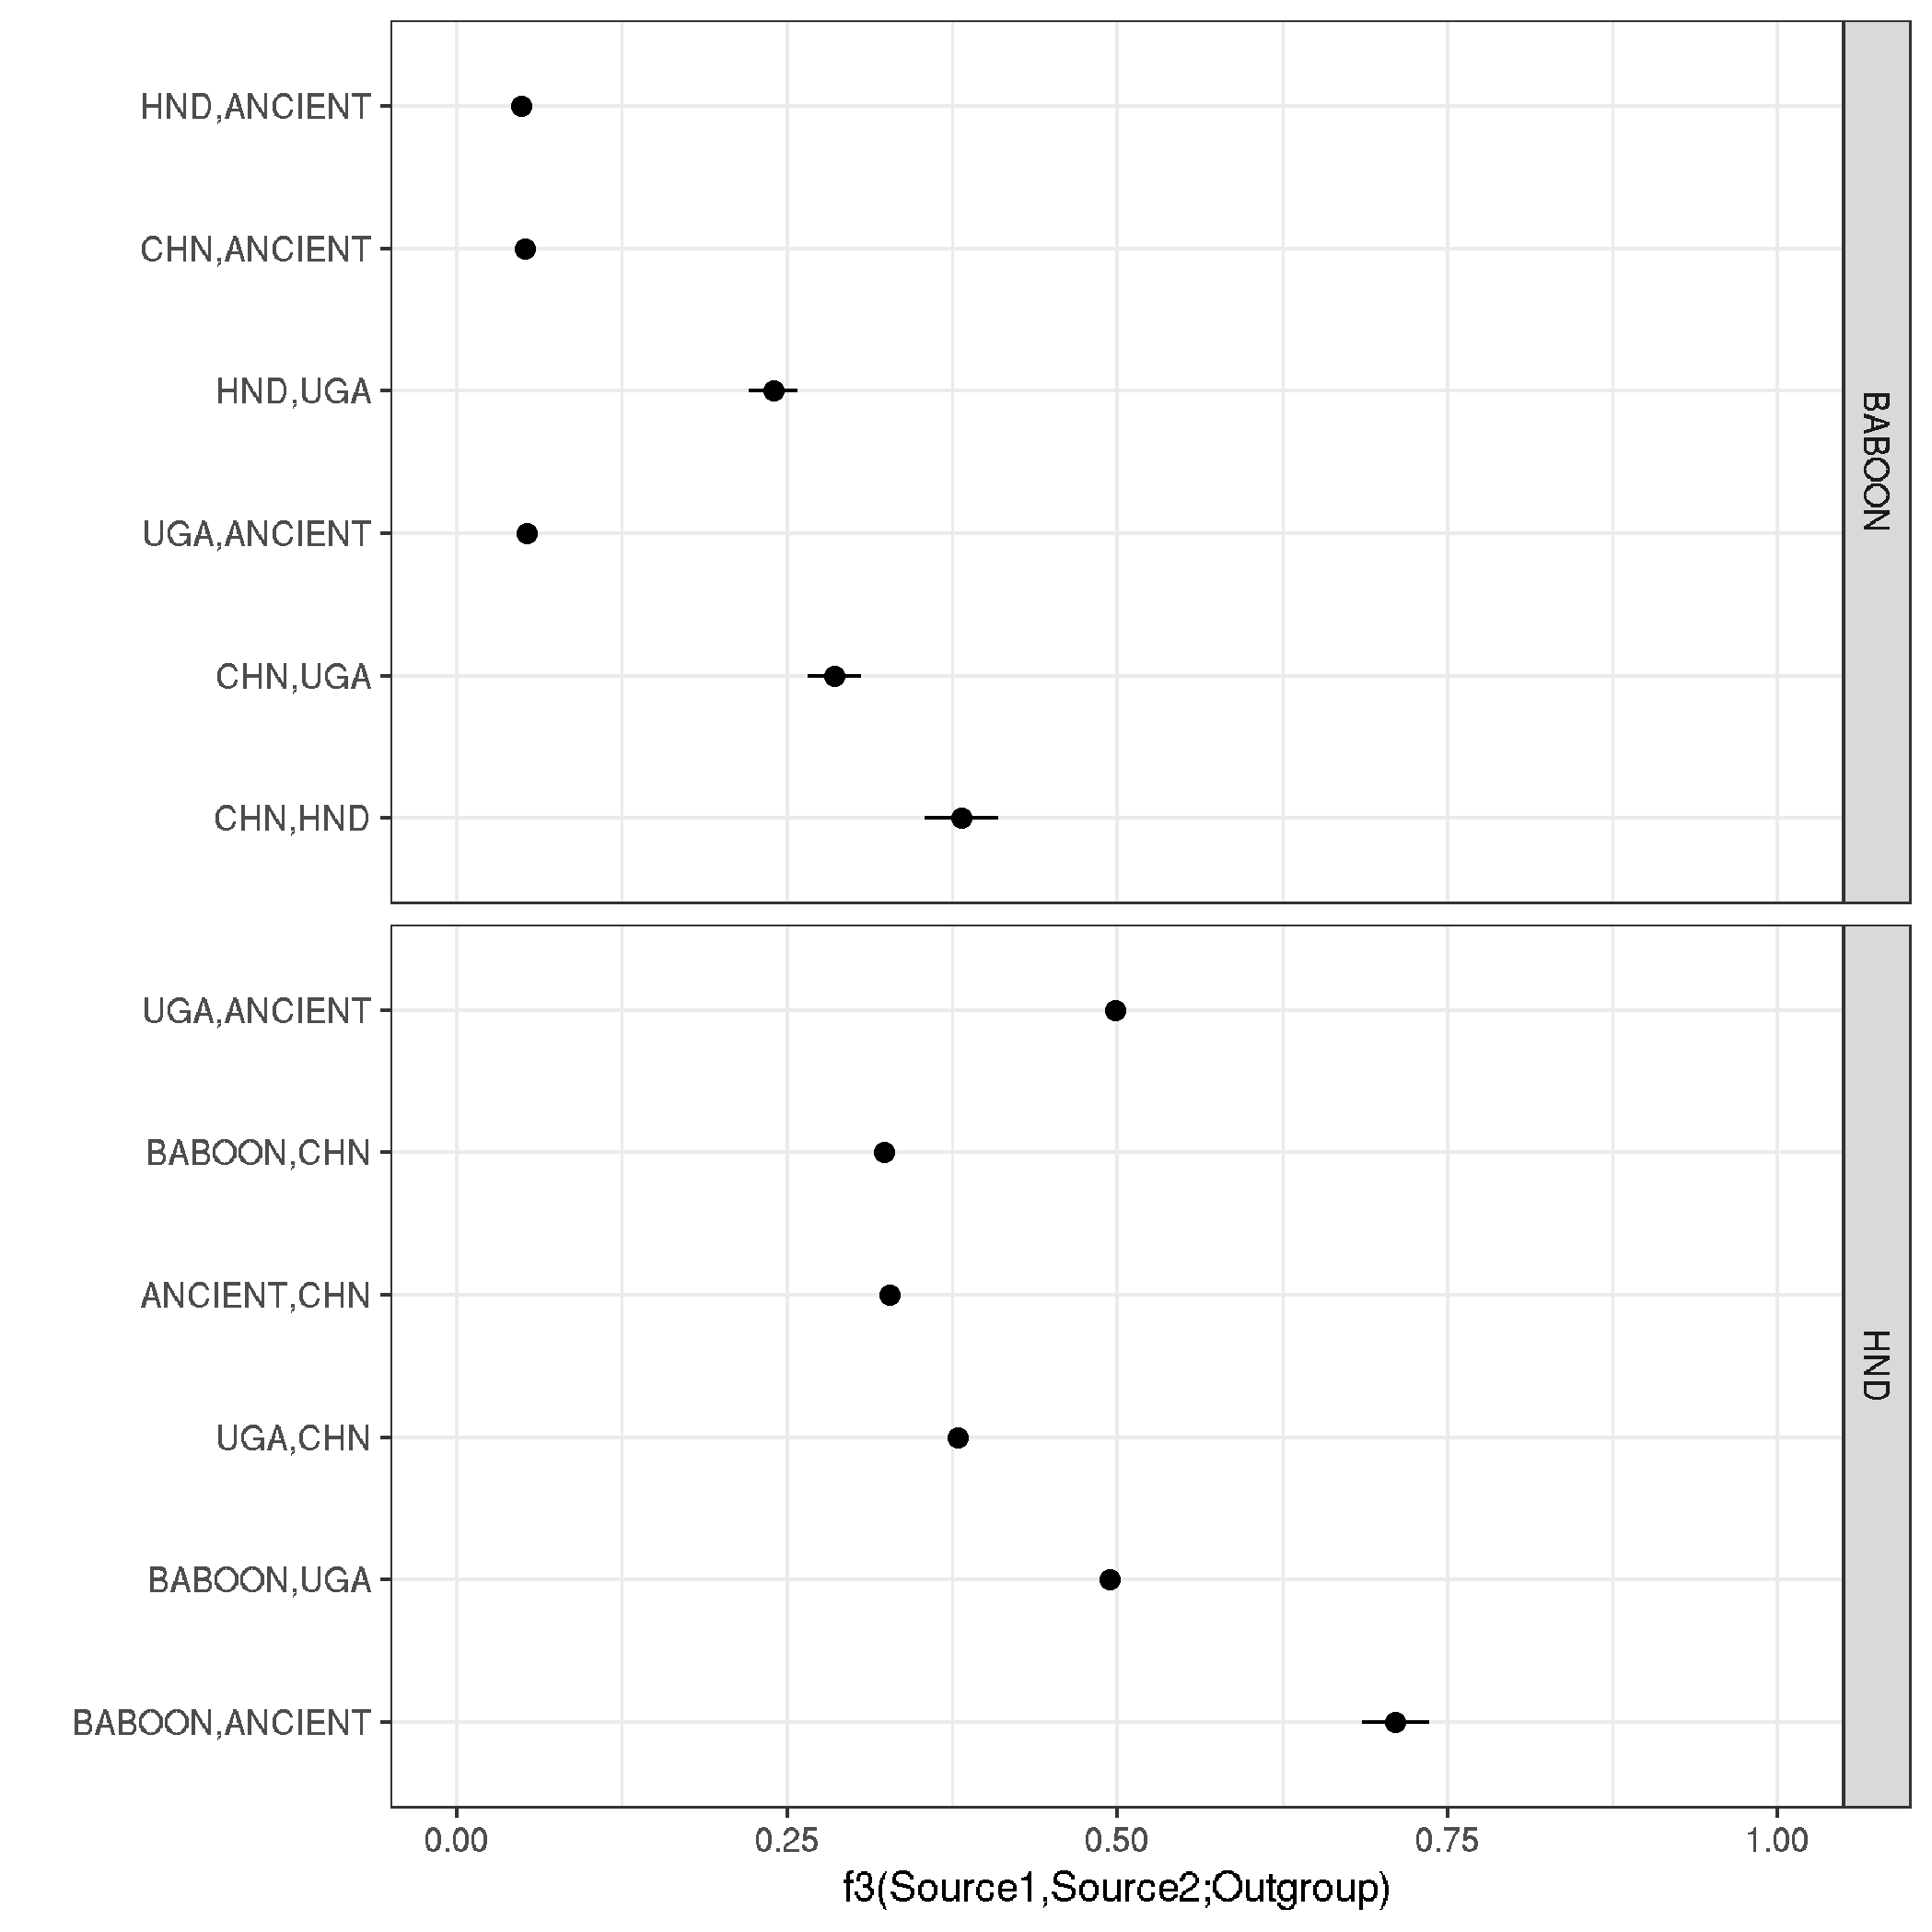
plotting admix data
# load libraries
library(tidyverse)

# read data
data <- read.delim("qp3Pop.clean.out", header=F, sep="\t")

# fix headings
colnames(data) <- c("Source_1", "Source_2", "Outgroup", "f_3", "std_err", "Z_score", "SNPs")

# make a plot
ggplot(data,aes(f_3, reorder(paste0(Source_1,",",Source_2), -f_3))) +
     geom_point(size = 2) +
     geom_segment(aes(x = f_3-std_err, y = paste0(Source_1,",",Source_2), xend = f_3+std_err, yend = paste0(Source_1,",",Source_2))) +
     theme_bw() + xlim(0,1) +
     labs(x = "f3(Source1,Source2;Outgroup)" , y = "") +
     facet_grid(Outgroup~., scale="free_y", space = "free_y")

# save it
ggsave("plot_admixtools_f3_statistics.png")
ggsave("plot_admixtools_f3_statistics.pdf", height = 4, width = 5, useDingbats = FALSE)